The Analysis
In this post I’ll go over some basic network analysis techniques. I have to admit my main desktop is starting to show its age, I think its about time for a new one. Why you ask? Well, for starters its just old. I forget exactly how many years, but to put it in perspective: my motherboard does not have TPM 2.0. I cannot upgrade to Windows 11 on this machine. If you don’t know already, Microsoft is deprecating Windows 10 October 14, 2025, so I plan on building a new machine before then. Who knows, I might even share the build process a bit. I’ve been building custom water-cooled PCs for years now. Not to get too much more off-topic, but I decided to ask ChatGPT to create a tombstone for Windows 10. Of course I forgot to tell it to make it an image so I received a text-based tombstone from ChatGPT.
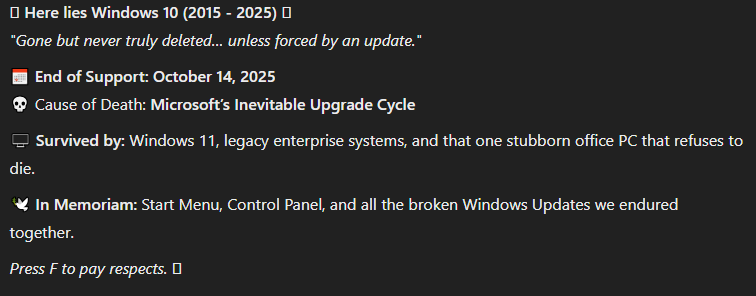
I have to say, its actually pretty funny. Anyways let’s get back on track.
My PC has been performing a bit sluggish as of late. The other day I was playing some Valorant and noticed a great deal of stuttering. At time time I was running a backup (which wasn’t unusual), so I attributed the performance issues to that. Later in the day when the backup finished, I noticed I was still facing some performance issues. I did the usual, view my performance and took a look at running processes to see if anything strange was going on. Maybe an application was attempting an update and using too much resources for whatever reason? Turns out the running processes looked normal. So now I wasn’t sure why I was having these issues as nothing seemed amiss with the running processes.
Next I wanted to see if maybe there was some network-related cause to my stuttering. Perhaps this wasn’t related to the performance of my machine, but rather my network. Well, I ran several network speed tests and reviewed traffic through my network dashboard, but couldn’t identify anything that might explain the issues I was experiencing.
I thought that there might be something malicious at play. Here are some key IoCs (Indicators of Compromise) to focus on when attempting to correlate unusual behavior to malicious activity:
Slow Performance – Unexpected lag, high CPU usage, or overheating.
Unusual Network Activity – Strange outbound connections or excessive data usage.
Frequent Crashes or Errors – Apps or the OS crashing without reason.
Unauthorized Changes – New programs, settings changes, or missing files.
Popup Ads or Redirects – Sudden appearance of unwanted ads or browser hijacking.
Disabled Security Features – Antivirus turning off by itself or firewall modifications.
Strange Processes – Unknown background processes consuming resources.
This isn’t a comprehensive list, but provides a solid foundation of what to keep your eyes open to.
So I pivoted my focus to network connections by running netstat to see what my active connections look like.
netstat -ano
This runs the netstat command with the -ano options allowing the following:
a – Shows all active connections and listening ports.n – Displays IP addresses numerically (instead of resolving hostnames).o – Shows the Process ID (PID) of the application using the connection.
We will probably be faced with a fairly large output. I like to take the output and place it into a text file so I can comb through the data a bit easier. Like so:
netstat -ano > <Path>.txt
Now we will still receive the same large output, but having it in a text file is much easier to manage. I like to delete lines that do no interest me so I am left with something more manageable.
Some “unusual” output to note:
Unusual High-Number Local Ports:
TCP 127.0.0.1:9999 127.0.0.1:49789 ESTABLISHED 8500
TCP 127.0.0.1:9999 127.0.0.1:49792 ESTABLISHED 8500
TCP 127.0.0.1:9999 127.0.0.1:49871 ESTABLISHED 8500
Strange open TCP ports:
TCP 0.0.0.0:6888 0.0.0.0:0 LISTENING 14676
TCP 0.0.0.0:7790 0.0.0.0:0 LISTENING 8956
Connections to Remote IPs on HTTPS (443):
TCP 192.168.1.205:50075 13.249.91.23:443 CLOSE_WAIT 6844
TCP 192.168.1.205:50275 104.18.41.183:443 CLOSE_WAIT 22512
TCP 192.168.1.205:58865 13.249.91.112:443 CLOSE_WAIT 6844
TCP 192.168.1.205:59854 104.18.41.158:443 ESTABLISHED 19860
TCP 192.168.1.205:60084 142.250.72.101:443 ESTABLISHED 19860
Strange open UDP ports:
UDP 0.0.0.0:6771 : 14676
UDP 0.0.0.0:6888 : 14676
UDP 0.0.0.0:52405 : 14676
SMB and Remote Management Ports (135, 139, 445):
TCP 0.0.0.0:135 0.0.0.0:0 LISTENING 1464
TCP 0.0.0.0:445 0.0.0.0:0 LISTENING 4
TCP 192.168.1.205:139 0.0.0.0:0 LISTENING 4
Now that we have a much shorter list to go through, let’s see what these connections are. We can start by identifying the process ID associated the connection:
tasklist | findstr 8500
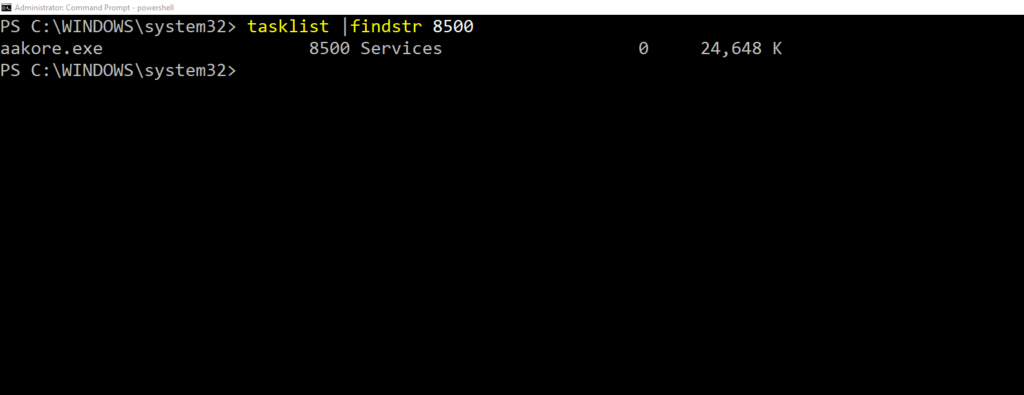
Output will look something like:
aakore.exe 8500 Services 0 24,528 K
Now I have no idea what aakore.exe is. So let’s dive a bit deeper:
wmic process where ProcessId=8500 get ExecutablePath
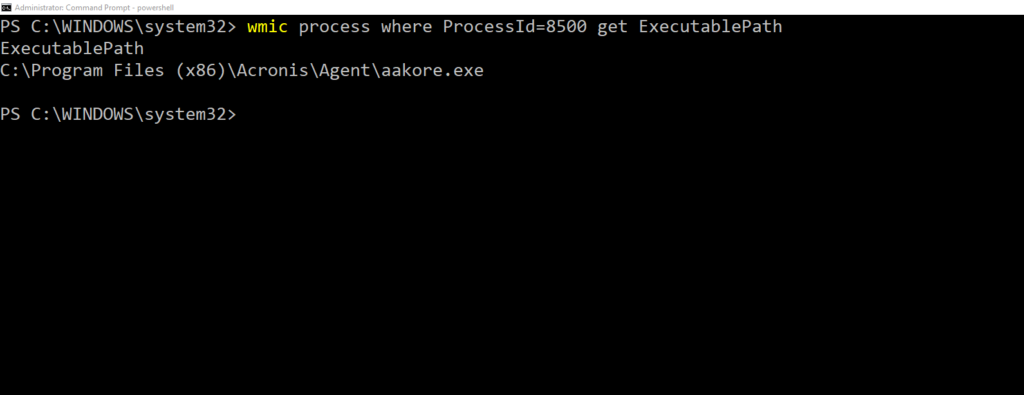
or
Get-Process -Id 8500 | Select-Object Path
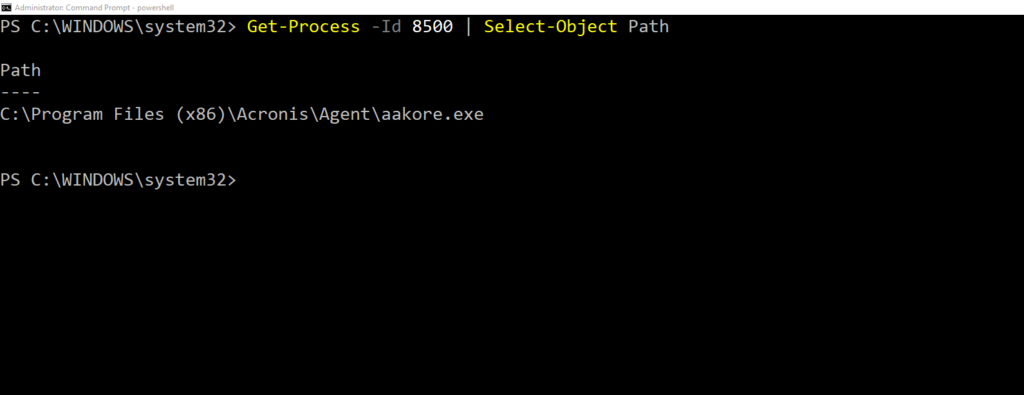
Both commands will yield similar results. Here’s my output from running the wmic command above:
ExecutablePath
C:\Program Files (x86)\Acronis\Agent\aakore.exe
And there we have it. After some Googling I found this to be the background service to the Acronis True Image suite.
Side Note – You can use something like Process Hacker or Process Explorer to dig deeper into these running services.
I utilized the above approach to identify the other remaining processes. After looking through all of the other connections and their associated processes, I deemed this to be a false positive. Meaning there were no active network connections causing my system issues, that is nothing malicious in nature bogging down my network. After the reboot, I still had the same issues and I was a bit disappointed as the issue persisted. I ended up updating my graphics drivers and the problems went away, even though Valorant stated I was having network connectivity issues throughout the time I was experiencing the issues.
The Takeaway
We were able to identify active network connections and dive into them a little deeper to see what applications were responsible for the connections. This is a very basic approach to network analysis and is only a small aspect of the process. Results such as these aren’t definitive proof that there are no malicious connections occurring. The malware on your system can be reaching out to a C2 server periodically and in a scheduled manner; that is reaching out every 30 minutes or hour, etc. This connection can also be very short in nature and very hard to spot unless you’re constantly monitoring your connections. The best approach if you suspect your system is reaching out to an external entity is to setup some sort of passive network capture. With this approach you can capture all traffic on your system and analyze it later using software like Wireshark. Always look at several IoCs by monitoring all types of system behavior. I highly recommend having a copy of Process Hacker 2 on your machine so you can analyze running processes quickly and efficiently. And remember, threat actors often disguise malicious software as legitimate system processes. Just because a service or binary looks familiar doesn’t mean it’s safe, dig deeper to confirm it’s not an imposter. Until next time, folks!

