

Volatility is the industry-standard open-source memory forensics framework. It was originally developed by Dr. Aaron Walters during his academic research at the University of New Orleans in the mid-2000s. It began as a prototype tool for extracting digital artifacts from volatile memory (RAM), and was first released publicly in 2007 at Black Hat DC.
Over time, it evolved into the leading open-source framework for memory forensics, widely adopted by incident responders, forensic analysts, and threat hunters. The project is now maintained by the Volatility Foundation, a nonprofit organization dedicated to advancing memory analysis and education.
Volatility works by parsing raw memory dumps to reconstruct forensic artifacts, everything from running processes and open network connections, to injected code and loaded DLLs. Unlike tools that rely on an installed agent or log data, Volatility operates completely offline. It analyzes RAM snapshots, making it ideal for:
- Incident response (pulling RAM from a compromised machine)
- Malware analysis (identifying injected shellcode)
- Threat hunting (detecting persistence mechanisms)
It supports both Volatility 2 (legacy, with broad plugin support) and Volatility 3, the modern Python 3-based framework we’re using in this post.
To demonstrate Volatility in action, we’ll be analyzing a real-world memory dump infected with the Cridex (also known as Bugat and Dridex) banking trojan, a widespread and destructive piece of malware that emerged in the early 2010s.
Also known as Bugat, Cridex was designed to:
- Steal banking credentials through form grabbing
- Record keystrokes and browser activity
- Download additional malware, often as part of larger botnets
Cridex is historically significant for its role in mass phishing campaigns and its modular, adaptable architecture. It was frequently spread via malicious email attachments, Microsoft Office macros, and exploit kits. Once inside a system, Cridex injected itself into trusted Windows processes to remain hidden in plain sight.
In 2014, Cridex evolved into Dridex, a far more sophisticated and still-active banking trojan that remains a common threat today.
The memory dump we’ll be using in this post is a Windows XP SP2 image captured from a system actively infected with Cridex. This sample has been widely used in digital forensics training labs and still offers valuable lessons for defenders.
You can view additional memory samples from the Volatility Foundation’s GitHub repository.
⚠ Disclaimer ⚠
The Cridex memory sample used in this post contains real malware artifacts and was captured from a system actively infected with the Cridex banking trojan. While the sample is intended for educational and research purposes, it may still contain live or reconstructable malicious components.
Download and analyze only in a secure, isolated environment (such as a VM with no internet access), and do not open any extracted binaries or execute dumped memory files outside of your forensic tools.
I am not responsible for any misuse or damage resulting from improper handling of the sample.
About the Memory Dump
- Filename:
cridex.vmem - Operating System: Windows XP SP2 x86
- Source: Captured from a live Cridex infection
- Hosted by: Masaryk University (Institute of Computer Science), Czech Republic
- Format: VMware
.vmem(raw memory snapshot) - Decompressed size: ~1.2 GB
In the sections that follow, we’ll load this image into Volatility 3, analyze running processes, detect injected code, and extract malicious memory segments for triage.
Setting Up Your Volatility Environment
Before we dive into memory analysis, let’s get Volatility 3 installed and ready to go. This version of the framework is written in Python 3, supports modern architectures, and continues to receive active development from the Volatility Foundation.
We’ll be using a Linux-based system (Kali in this case), and assuming the Cridex memory dump (cridex.vmem) is located on your Desktop.
First let’s download Volatility and move into its installation directory:
git clone https://github.com/volatilityfoundation/volatility3.git
cd volatility3
Volatility 3 doesn’t use a requirements.txt, so you’ll need to install its required libraries manually:
pip3 install capstone pefile pytz
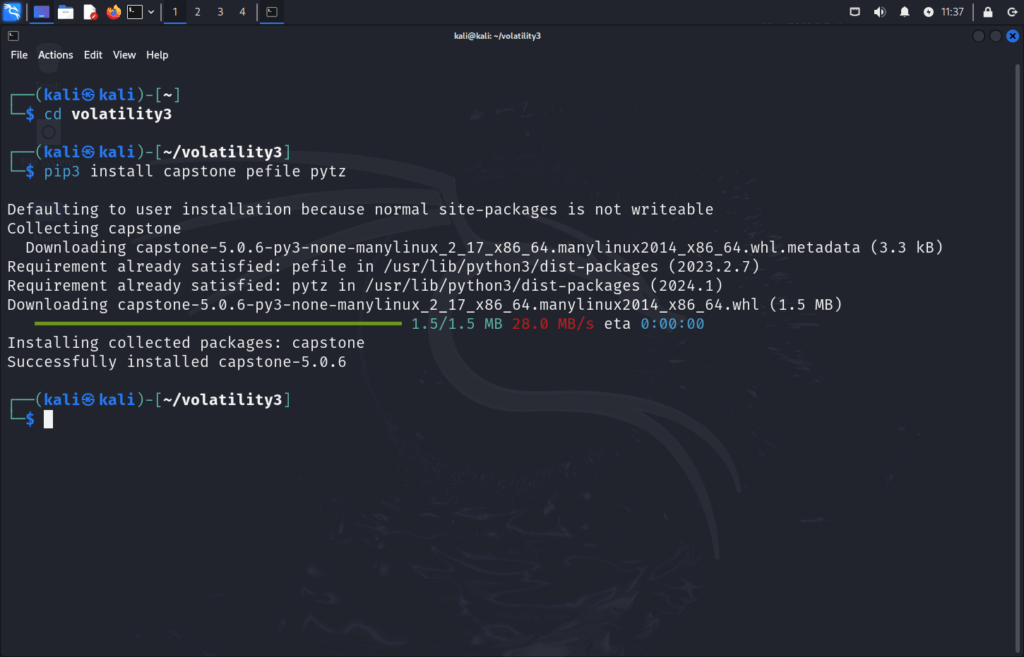
Breakdown of this command:
pip3 – Python’s package manager
install – Install command
capstone – A multi-platform, multi-architecture disassembly framework.
pefile – A Python module for reading and working with PE (Portable Executable) files (like .exe, .dll).
pytz – Adds support for accurate and cross-platform timezone handling.
We can also run the following dependency install command for later steps:
pip3 install yara-python pycryptodome
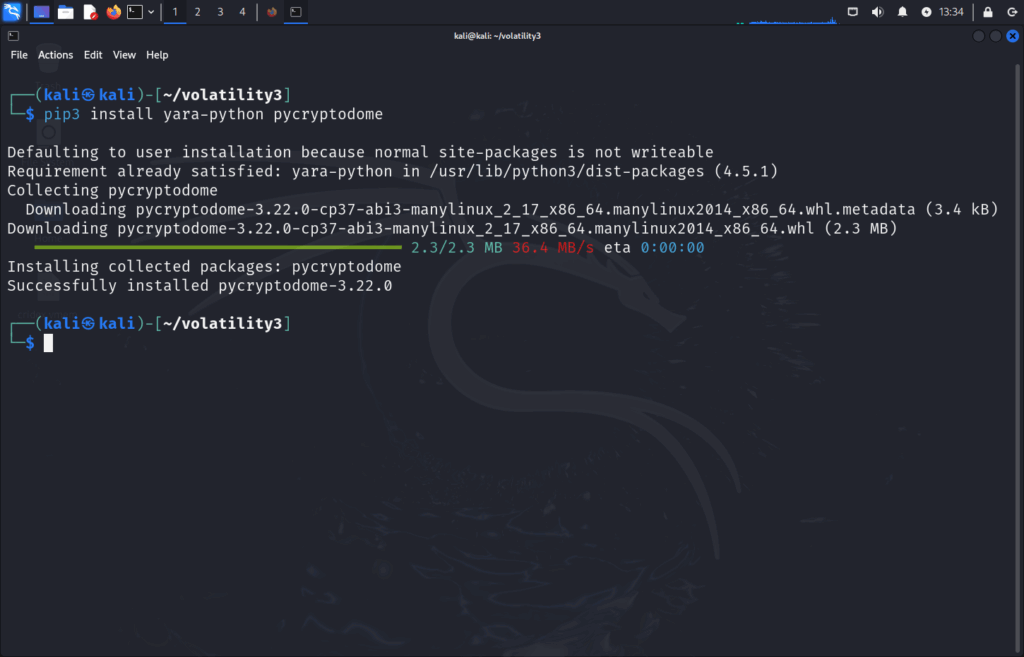
yara-python – Python bindings for YARA, used to scan files/memory for patterns (malware detection).
pycryptodome – Cryptographic library (AES, RSA, hashing), often used for decoding malware or secure data handling.
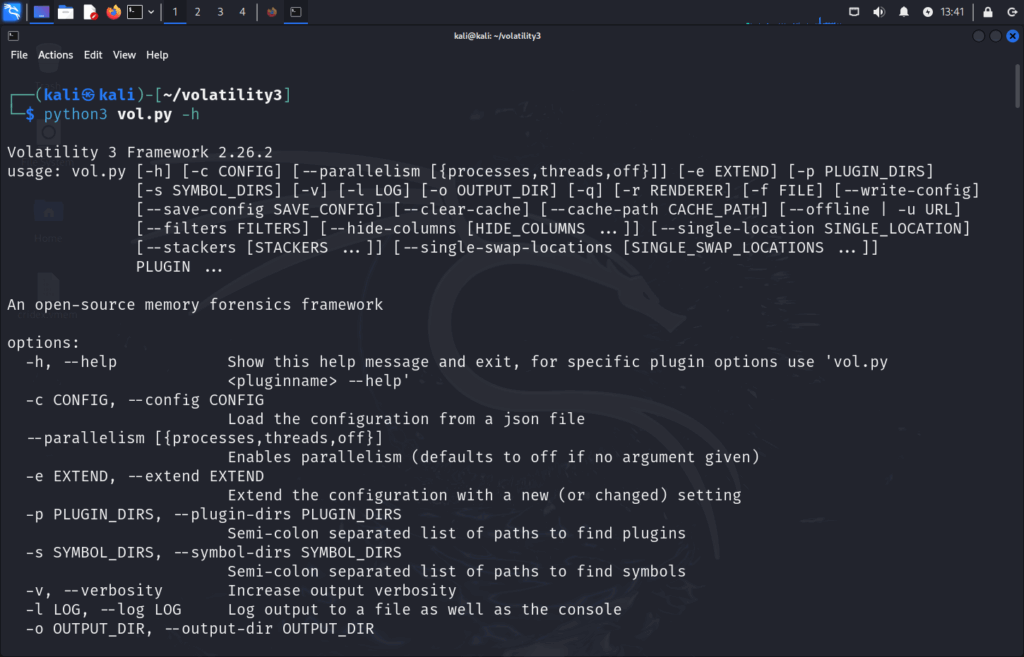
Now let’s verify Volatility is setup and ready to go:
python3 vol.py -h
info
Next, let’s run Volatility against the memory dump to confirm it can read the image:
python3 vol.py -f ~/Desktop/cridex.vmem windows.info
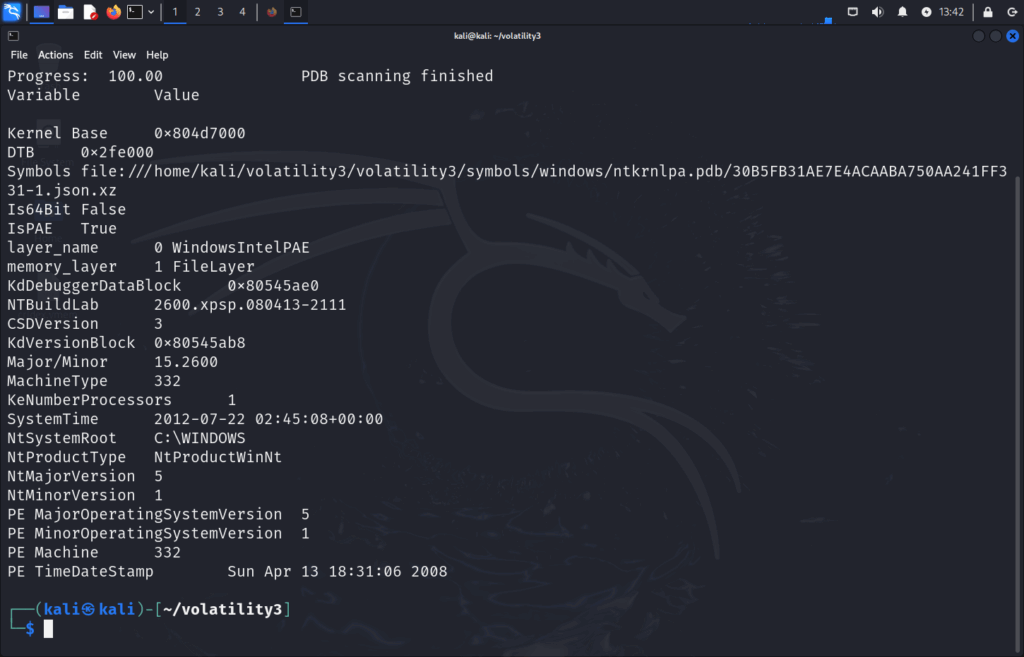
Great! Looks there are no errors thrown and Volatility read the memory file. A quick glance at this output:
PDB scanning finished
Volatility successfully downloaded and applied the correct symbol file (ntkrnlpa.pdb) for parsing Windows internals.
NTBuildLab: 2600.xpsp.080413-2111
This confirms you’re working with Windows XP SP2, this matches the known Cridex infection environment.
2600 is the major build number for Windows XP. More info:
xpsp – stands for Windows XP Service Pack.
080413-2111 – is the build timestamp (built on April 13, 2008, at 21:11 UTC)
Is64Bit: False
Confirms a 32-bit OS (expected for XP SP2).
SystemTime: 2012-07-22 02:45:08
This was the system time at the moment the memory image was captured, helpful for timeline analysis.
MachineType: 332
Indicates x86 architecture (again, aligns with 32-bit XP).
Obviously there’s more to this output than what I mentioned above, but this is some crucial data that we can verify.
At this point, Volatility has correctly parsed the memory dump and automatically downloaded the proper symbol file (ntkrnlpa.pdb) to interpret kernel structures. The output confirms we’re dealing with a 32-bit Windows XP SP2 machine captured on July 22, 2012, consistent with the known environment of a Cridex infection. With this foundation in place, we can now begin analyzing active processes and identifying signs of malicious behavior.
Investigating Suspicious Processes in Memory
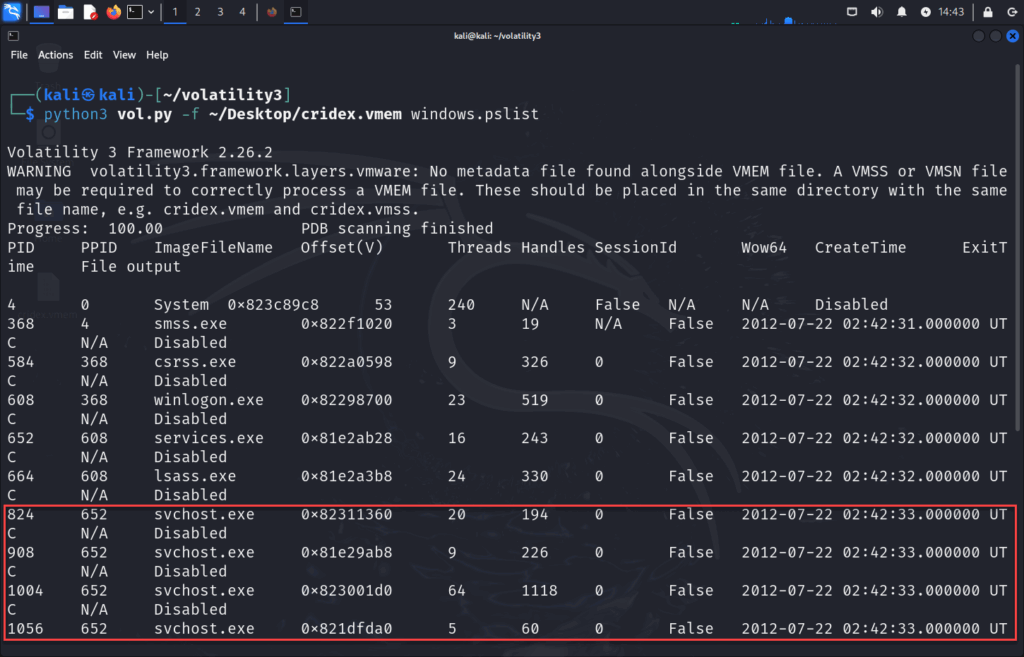
pslist
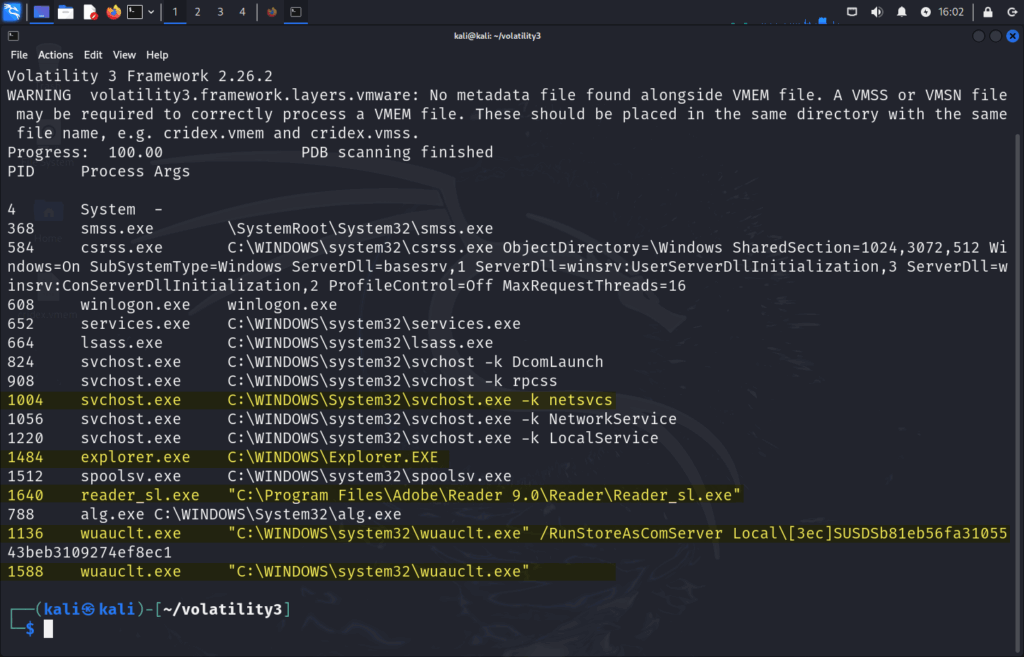
First, let’s enumerate all running processes captured in memory by listing Active Processes with pslist:
python3 vol.py -f ~/Desktop/cridex.vmem windows.pslist
This gives you:
- PID (Process ID)
- PPID (Parent Process ID)
- Process name
- Start time
- Thread and handle counts
What to Look For:
- Duplicate or misspelled process names (e.g.,
svhost.exeinstead ofsvchost.exe)
- Unexpected parent-child relationships
- Missing start times (can signal injection or hidden processes)
In this image, you should see a suspicious process named svchost.exe that doesn’t behave like a normal system process (we’ll prove this in the next steps).
A few things to note regarding svchost.exe and why it raises suspicions:
Although this can be legitimate, since Windows uses multiple svchost processes to run different service groups. But here’s what makes PID 1004 suspicious:
- It has 64 threads and 1,118 handles, far more than the others.
- It’s launched at the same second as the other
svchostinstances, but is significantly heavier. - Later (as we’ll confirm in
malfind), this is the injected process used by Cridex.
pstree
Next, we can understand how processes relate to each other by visualizing he Process Hierarchy with pstree:
python3 vol.py -f ~/Desktop/cridex.vmem windows.pstree
This shows a tree structure based on parent-child relationships.
What to Look For:
svchost.exelaunched by something other thanservices.exe(e.g.,explorer.exe,cmd.exe).- Suspicious child processes like cmd.exe, powershell.exe, or no children at all.
If you find an svchost.exe process not tied to system startup, flag it for further inspection.
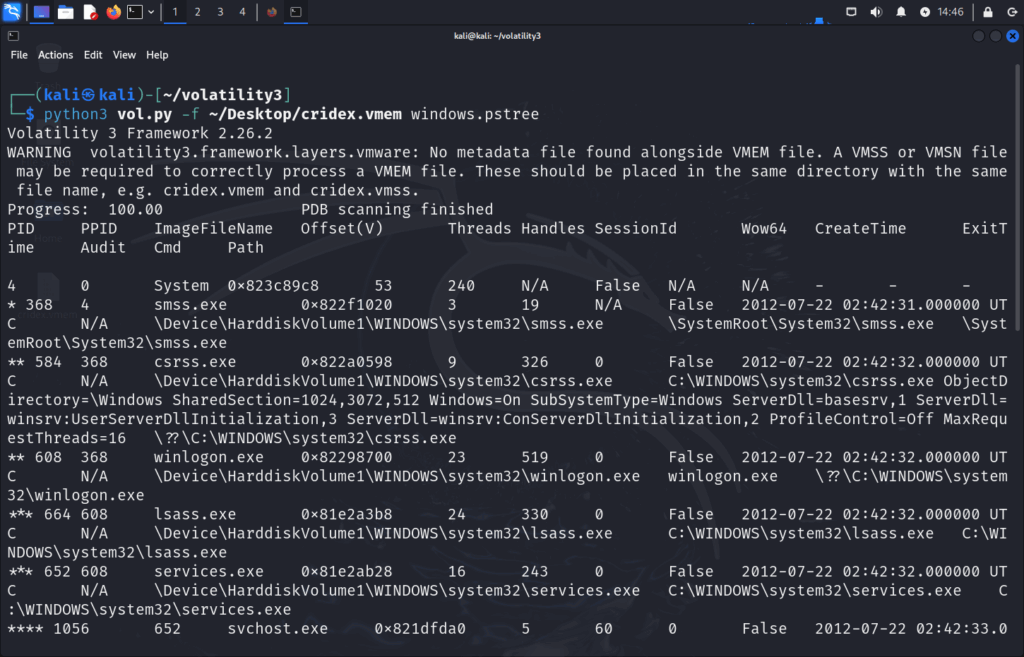
Scrolling down a bit, what we can identify is that PID 1004 (svchost.exe) has spawned two child processes, both wuacult.exe with PIDs 1136 and 1588.
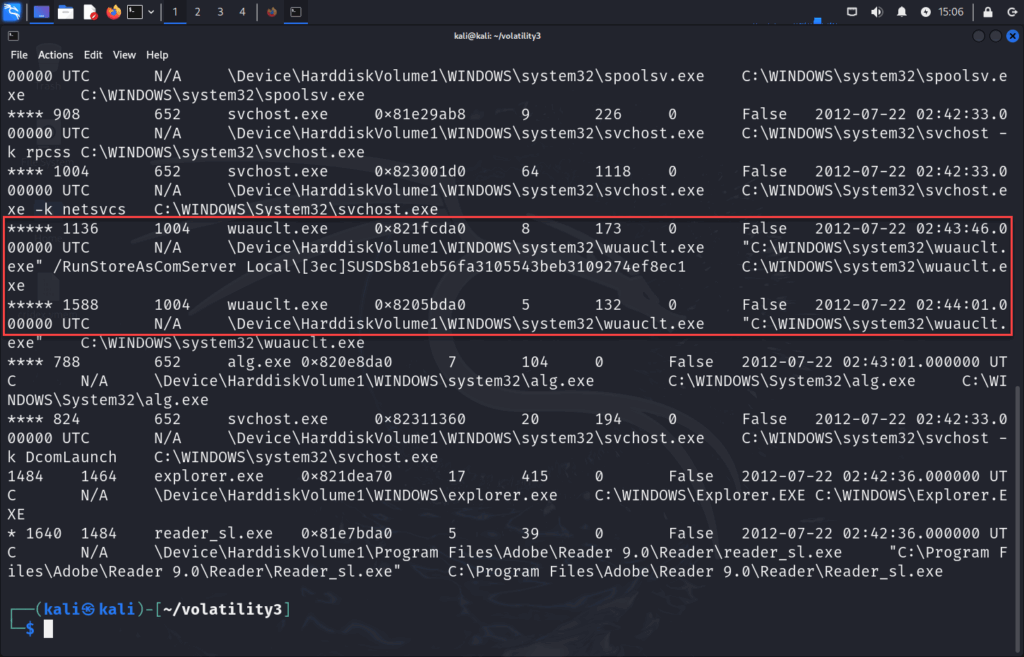
Additional information from previous pslist command:
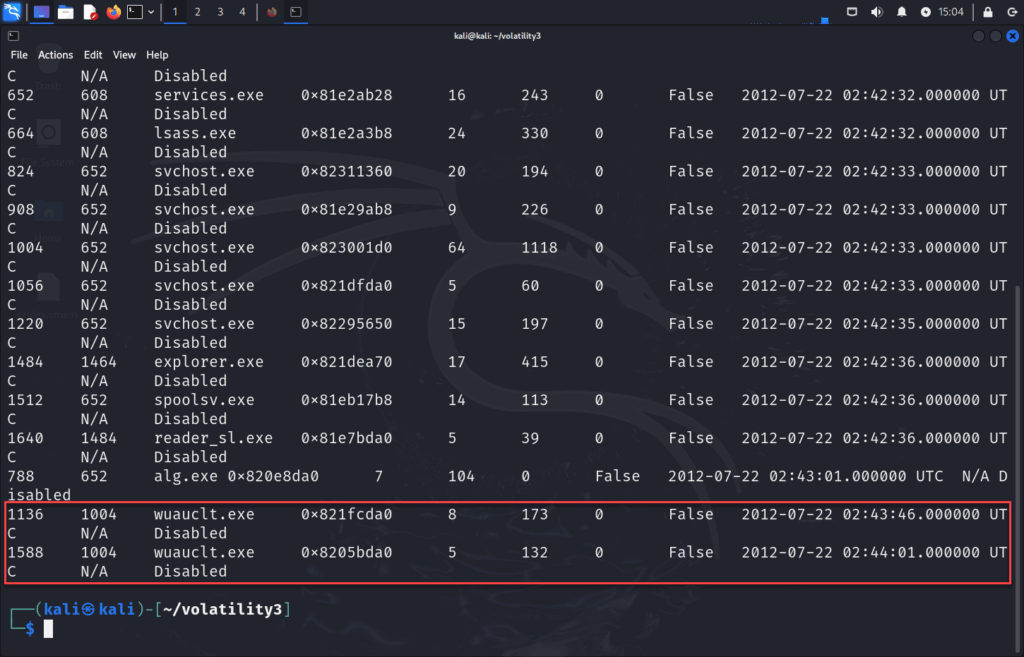
This is unusual. Most svchost.exe processes don’t spawn child processes, but this one does. This indicates unusual behavior, Cridex is known to inject into svchost.exe and then spawn additional processes for data exfiltration or C2 beacons under the guise of Windows Update.
malfind
Now we can move on an utilize the malfind plugin to scan for code that doesn’t match loaded modules.
python3 vol.py -f ~/Desktop/cridex.vmem windows.malfind
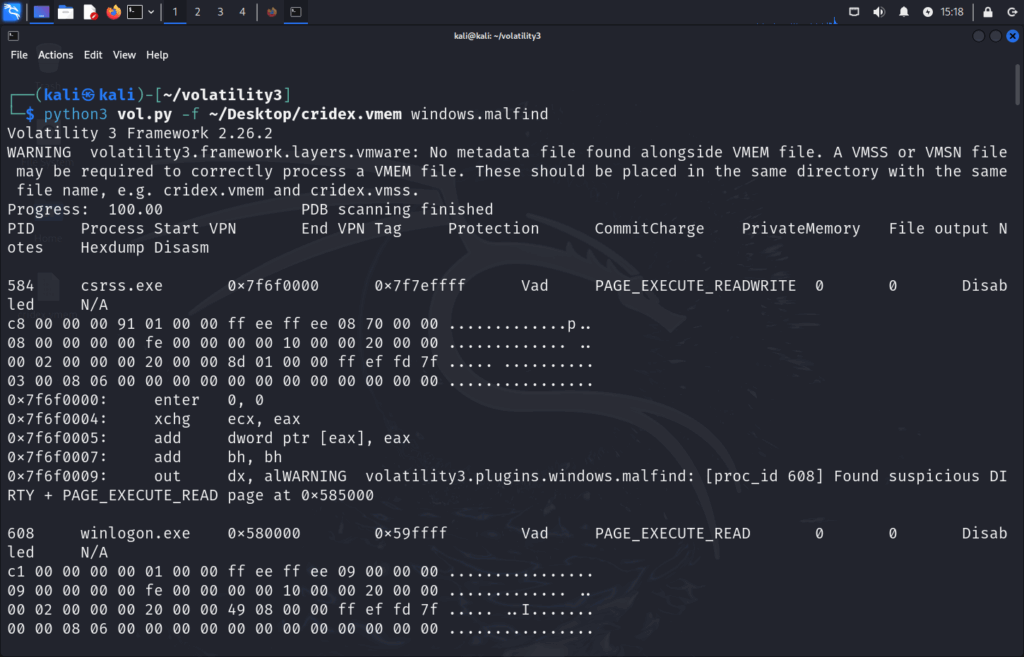
This plugin scans memory for regions with PAGE_EXECUTE_READWRITE permissions, a classic indicator of shellcode or manually injected code.
Just a side note:
I am not an expert on assembly or analyzing code for that matter. There was a great deal of additional research that went into the following information. I believe in continuous learning, so if you ever feel like sharing more information on this topic, feel free to reach out to me here or on LinkedIn.
What to Look For:
- Memory regions with
PAGE_EXECUTE_READWRITEorPAGE_EXECUTE_READ, uncommon in clean processes. - Injected memory with no file backing, meaning it wasn’t loaded from disk.
- Suspicious disassembly patterns (see below).
Repeated add byte ptr [eax], al. More info on that:
This leads to NOP sleds – a sequence of do-nothing instructions that leads into real shellcode, essentially shellcode junk.
Unusual instructions like enter, xchg, out, or raw opcodes. Although these are valid CPU instructions, they rarely show up in legitimate user-mode processes with no reason. More info on that:
enter 0, 0 – Allocates stack space for a function. Seeing it at the start of disassembled memory can mean shellcode.
xchg ecx, eax – Swaps values in registers. Used sometimes in polymorphic code (self-mutating).
out dx, al – Sends data to a hardware port — rarely ever used in user-level apps.
Other Things to Look For:
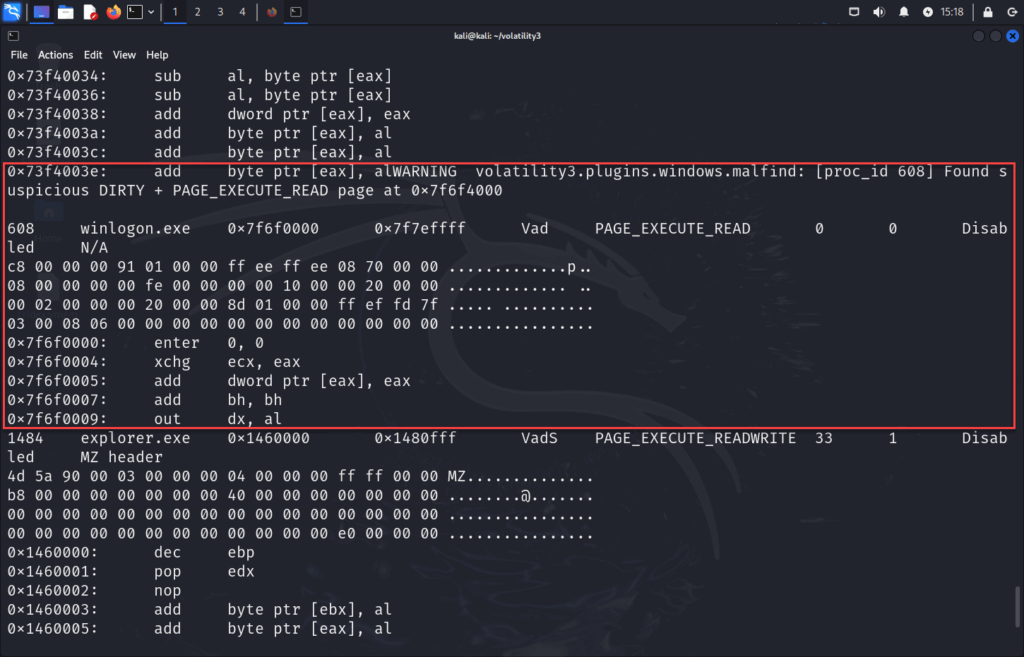
- Processes that don’t typically host code (e.g.,
winlogon.exe,csrss.exe). - Presence of MZ headers in memory, indicates a full PE file (e.g., reflectively loaded DLL).
More bout MZ headers:
4D 5A = MZ in ASCII, This is the first two bytes of every Windows executable (EXE or DLL). This is also known as It’s called the DOS header of a PE (Portable Executable) file. That’s the start of a Windows executable (PE file). All Windows binaries start with the magic bytes MZ, which is short for Mark Zbikowski, a Microsoft engineer.
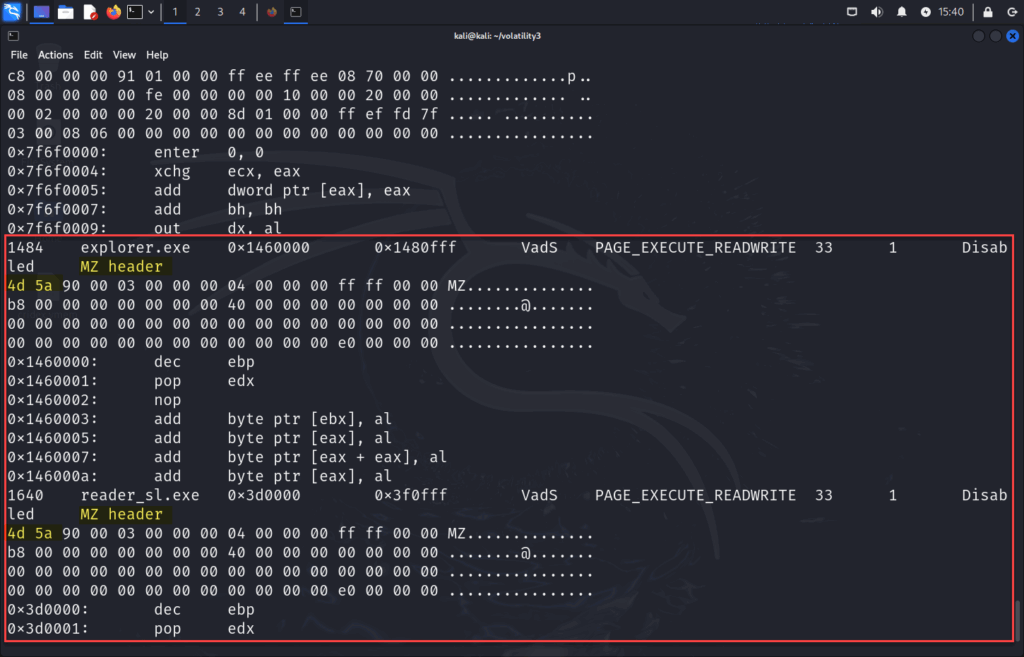
Both explorer.exe and reader_sl.exe do contain MZ headers, indicating that complete executables were loaded directly into memory, possibly as part of reflective DLL injection.
If malfind flags memory containing a valid MZ header (like 4D 5A), it means a full Windows executable (PE file) was loaded into memory, often via reflective DLL injection or unpacking. This is not normal behavior for legitimate processes like explorer.exe or reader_sl.exe, and is a strong indicator of in-memory malware. Legitimate PE files are loaded by the Windows loader, not raw in memory
So when Volatility’s malfind shows MZ headers in a non-service process like reader_sl.exe, and it’s marked as PAGE_EXECUTE_READWRITE, that’s highly indicative of:
- Injected malware
- Staged payloads
- Or even unpacked loaders (e.g., the second stage of a trojan like Cridex)
In clean systems, memory rarely contains long runs of meaningless instructions. Repeating lines like add byte ptr [eax], al are often used to pad malicious code. Likewise, low-level instructions like enter, xchg, and out are rarely seen in normal Windows processes. Their presence, especially in memory with PAGE_EXECUTE_READWRITE permissions , is a strong indicator of code injection or unpacked shellcode.
cmdline
Let’s move onto identifying command-line arguments in this sample:
python3 vol.py -f ~/Desktop/cridex.vmem windows.cmdline
Let’s take a look at 1004 svchost.exe C:\WINDOWS\System32\svchost.exe -k netsvcs. This is normal-looking at first glance. This is a legitimate command-line used by real svchost.exe processes.
What we know:
- We already know
PID 1004has abnormally high thread and handle counts. - It spawns two
wuauclt.exechildren (not typical forsvchost). - It was suspected in prior analysis, even though this cmdline seems fine.
Many valid Windows services (like Windows Update) run under this service group. Malware authors know this, and often copy it to blend in. The point here is to look at the bigger picture, command-line arguments alone can appear benign. Always correlate with behavior and memory analysis.
Now, moving onto 1136 "C:\WINDOWS\system32\wuauclt.exe" /RunStoreAsComServer Local[3ec]SUSDSb81eb56fa3105543beb3109274ef8ec1 and 1588 "C:\WINDOWS\system32\wuauclt.exe".
These are suspicious as Legitimate wuauclt.exe (Windows Update) shouldn’t be manually launched like this.
Additionally, the /RunStoreAsComServer switch is not documented and rarely used. Lastly, The second one has no arguments at all, which is odd.
The switch RunStoreAsComServer suggests COM object activation, a known method to achieve in-process execution via Windows internals. Attackers may use this to spawn malicious COM-based payloads inside trusted processes, hiding from EDRs. It likely doesn’t do anything when called legitimately, but malware can hook or patch wuauclt.exe to treat it as a loader, using this flag as a trigger. What this may mean Cridex may have spawned fake Windows Update clients to run injected or second-stage code, while mimicking normal system processes.
This flag isn’t part of any documented usage for Windows Update clients. Instead, it’s likely a custom trigger used by malware, either as a staging mechanism or to activate malicious code via COM execution. Malware families like Cridex are known to inject into legitimate Windows binaries and pass fake command-line arguments to control behavior, hide in memory, and blend in with legitimate traffic.
Lastly, let’s look at "C:\Program Files\Adobe\Reader 9.0\Reader\Reader_sl.exe" and C:\WINDOWS\Explorer.EXE. These match normal behavior, but we already saw MZ headers in their memory, which means something malicious may have been injected into them after launch.
This supports:
- Reflective DLL injection
- In-memory stagers
- Or shellcode execution in trusted processes (living off the land)
To summarize:
PID 1004 (svchost.exe) used -k netsvcs, which is normal, but we already saw unusual thread counts and child processes, so this alone doesn’t clear it.PIDs 1136 and 1588(wuauclt.exe) were much more suspicious:- One used an undocumented switch:
/RunStoreAsComServer - The other had no arguments at all
- Both were children of the suspicious svchost.exe
- One used an undocumented switch:
reader_sl.exeandexplorer.exehad expected arguments, yet malfind showed full PE files in memory. This suggests reflective injection after launch.
dumpfiles
Lastly, we can extract file-backed memory regions, including potential injected or reflectively loaded payloads:
python3 vol.py -f ~/Desktop/cridex.vmem -o ~/Desktop/vol_dump -r json windows.dumpfiles
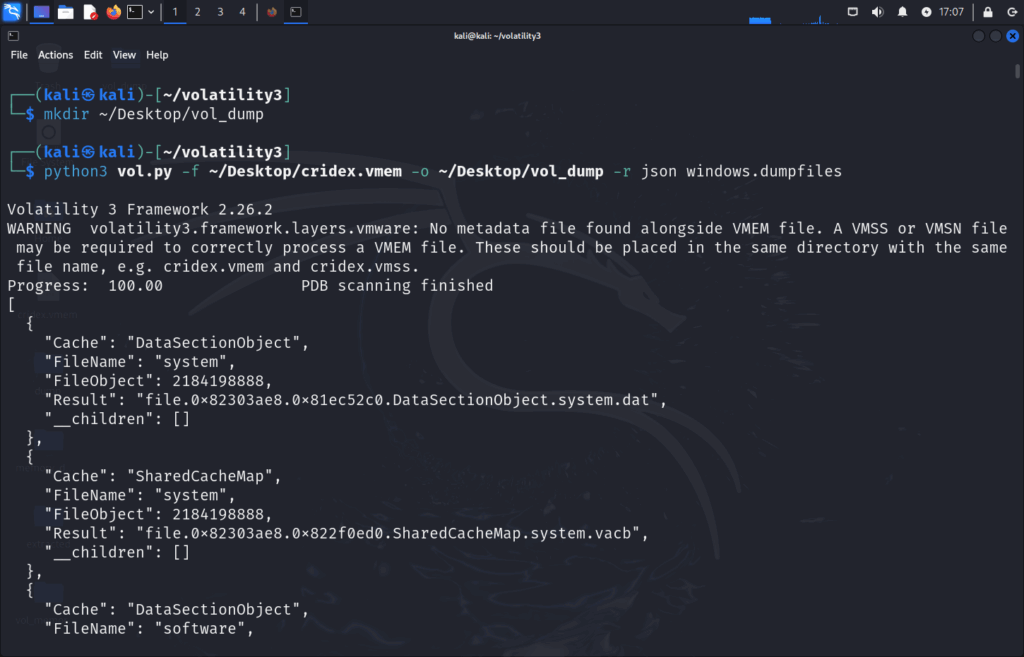
Depending on the memory dump, we may end up with several files that look like so:
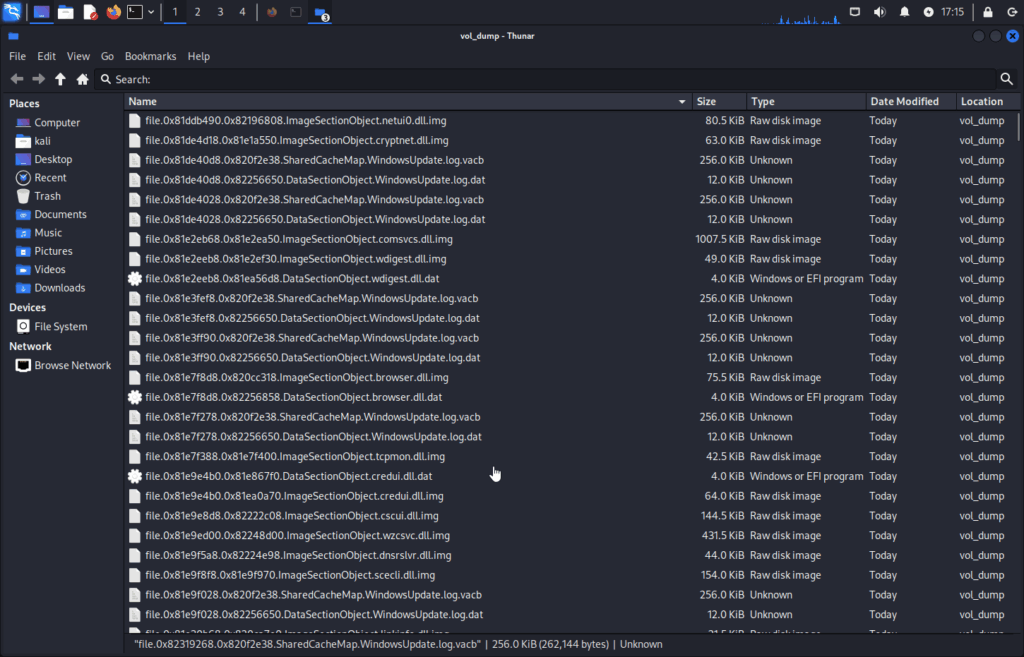
This will save dumped files into the specified folder. You can analyze these files with tools like:
- PEStudio or Detect It Easy (quick binary fingerprinting)
- Ghidra or IDA Free (static code analysis)
- VirusTotal (hash search)
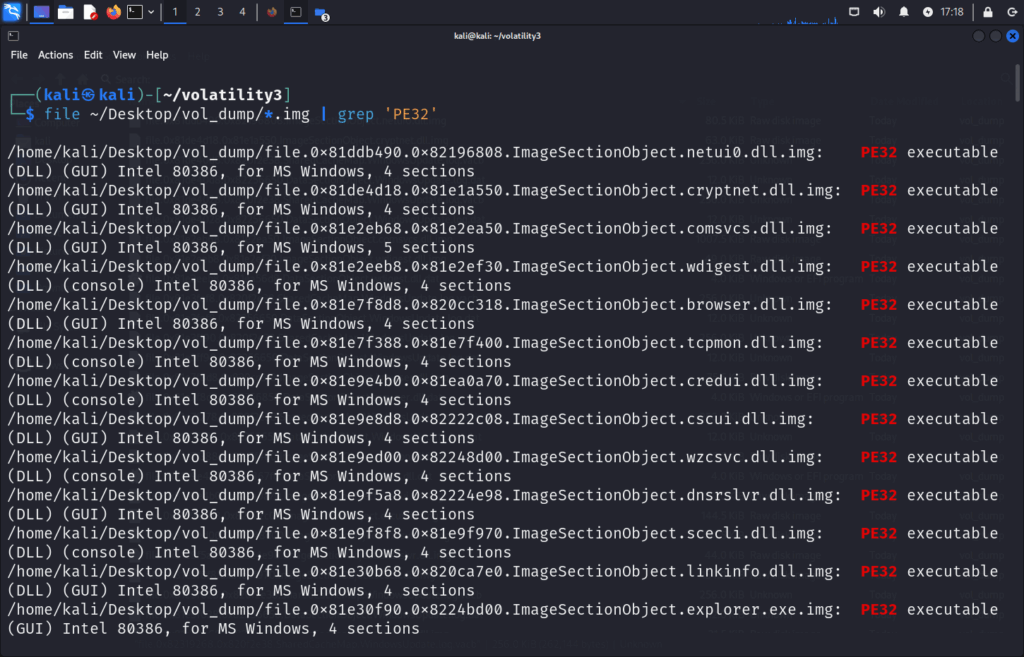
We can use the following command to identify PE files for further analysis:
file ~/Desktop/vol_dump/*.img | grep -i 'dll' | grep 'PE32'
Altternatively, we can dump specific process for review, like the malfind examples with MZ headers PID 1484 explorer.exe or PID 1640 reader_sl.exe:
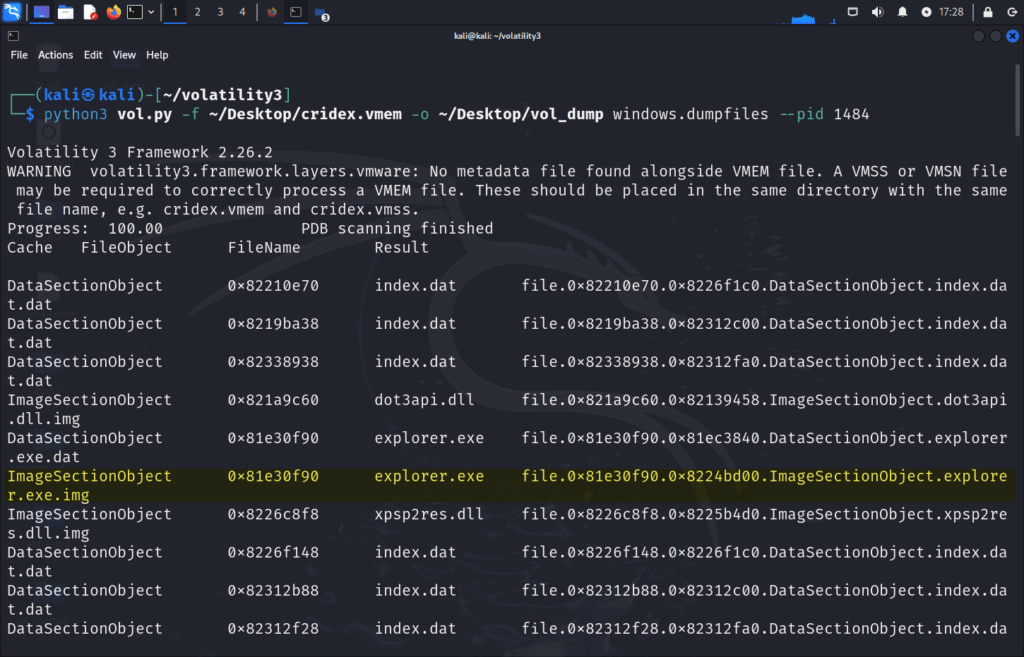
python3 vol.py -f ~/Desktop/cridex.vmem -o ~/Desktop/vol_dump windows.dumpfiles --pid 1484
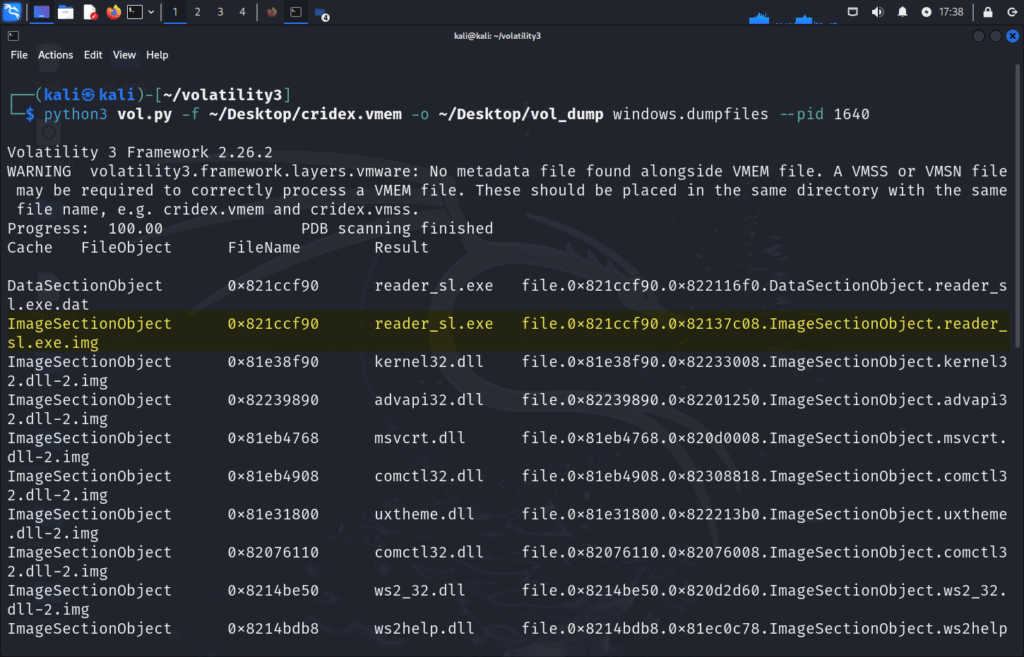
python3 vol.py -f ~/Desktop/cridex.vmem -o ~/Desktop/vol_dump windows.dumpfiles --pid 1640
This can narrow down our search and focus the analysis on processes of interest, particularly those flagged by malfind with suspicious memory regions or MZ headers. By isolating and extracting only the memory contents of these processes, we can prioritize likely payloads, submit hashes to VirusTotal, reverse engineer samples with tools like PEStudio or Ghidra, and potentially identify in-memory-only malware that never touched disk.
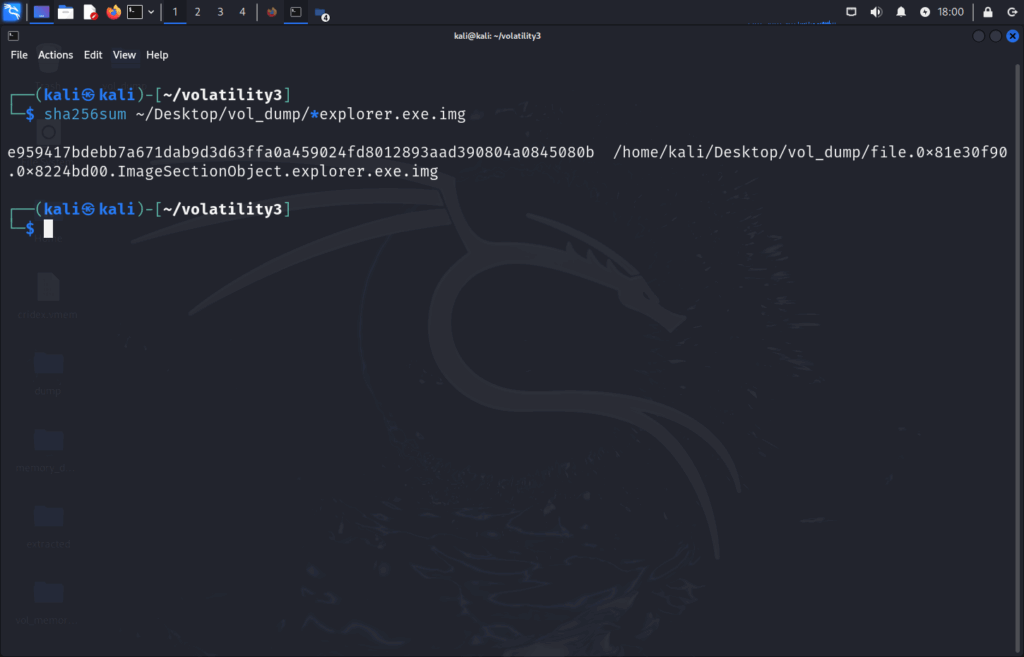
ImageSectionObject 0x81e30f90 explorer.exe file.0x81e30f90.0x8224bd00.ImageSectionObject.explorer.exe.img and ImageSectionObject 0x821ccf90 reader_sl.exe file.0x821ccf90.0x82137c08.ImageSectionObject.reader_sl.exe-1.img interests us as these were the files found with malfind.
Digging deeper we can grab the sha256 hash of the file like so:
sha256sum ~/Desktop/vol_dump/*explorer.exe.img
sha256sum ~/Desktop/vol_dump/*reader_sl.exe.img

Running these in VirusTotal shows:


These hits may not identify the main Cridex binary, but instead one of the following:
- A dropper or stager (initial payload that injects the real malware)
- A memory-stub fragment of the actual Cridex code (not full sample)
- A decoy executable with minor modifications used by Cridex to gain execution
As mentioned before, once dump files are extracted from memory using Volatility 3, they can be analyzed using a variety of tools, like Detect It Easy (DIE), PEStudio, or IDA/Ghidra.
Volatility 3 provides comprehensive memory analysis, but currently lacks the procdump plugin found in Volatility 2. For extracting fully reconstructed executables from memory (like Cridex’s injected payload in explorer.exe), Volatility 2 remains the better choice.
If your goal is to retrieve the original executable payloads (as opposed to memory-mapped DLLs and sections), consider using Volatility 2’s procdump plugin. I won’t cover the installation process here as that information can be found all over the internet, but it is similar to Volatility 3’s install process.
You can retrieve the original executable payloads via the following commands:
python2 vol.py -f ~/Desktop/cridex.vmem --profile=WinXPSP2x86 procdump --pid=1484 -D ~/Desktop/exe_dumps
python2 vol.py -f ~/Desktop/cridex.vmem --profile=WinXPSP2x86 procdump --pid=1640 -D ~/Desktop/exe_dumps
Once you have your exes, you can grab the sha256 hash of the files:
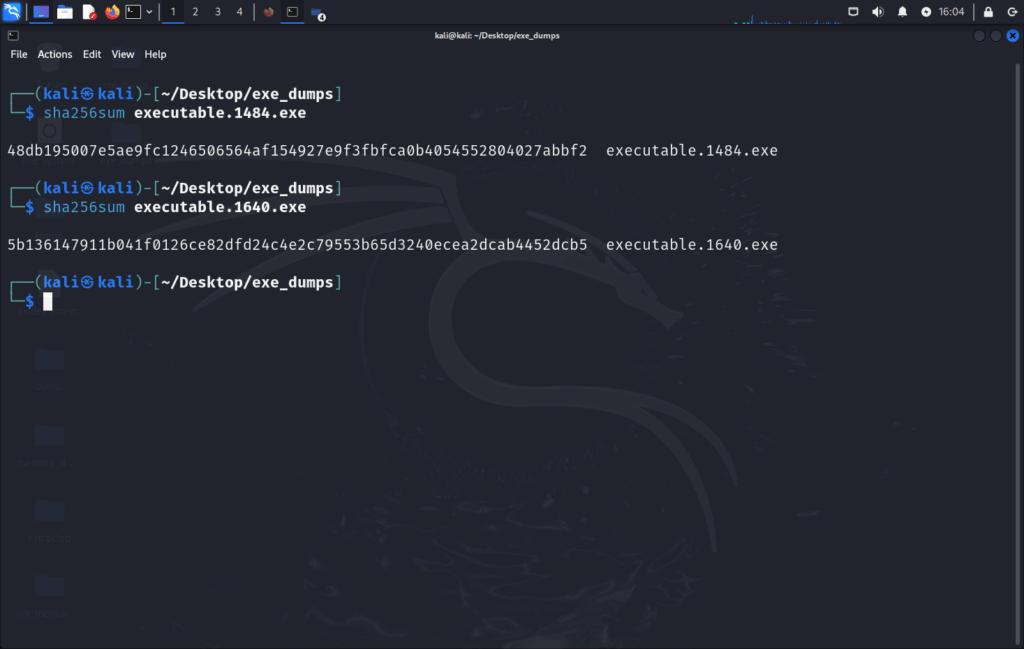
A quick search for these file hashes on VirusTotal results in the following:
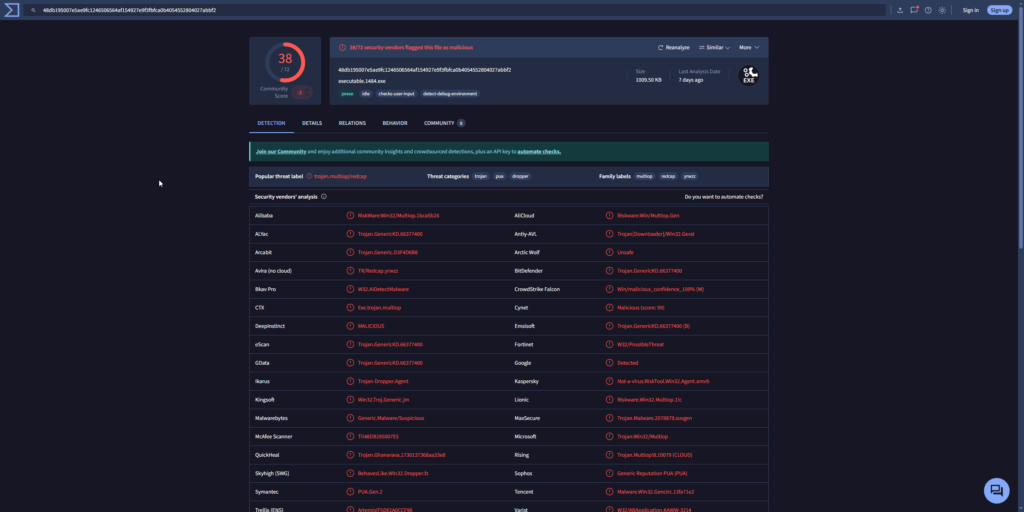
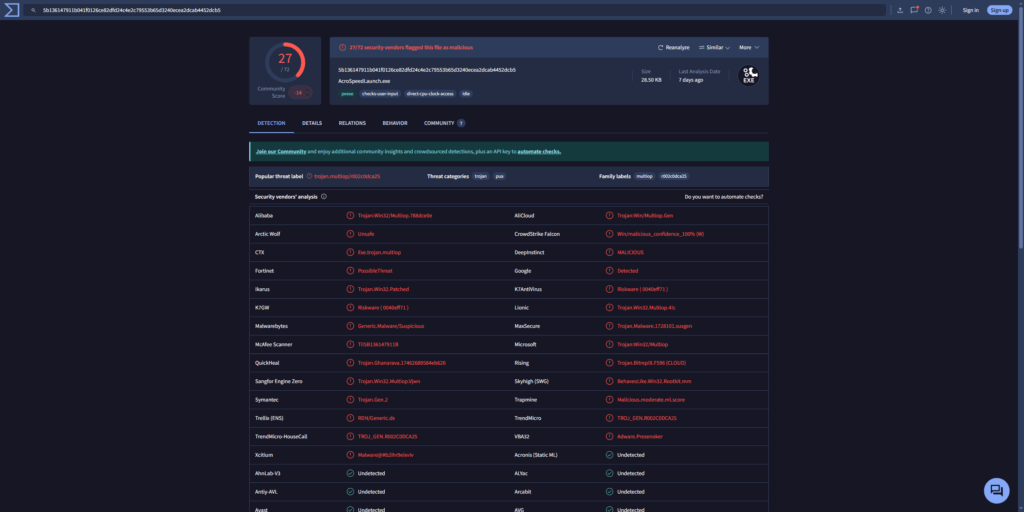
Conclusion
This analysis demonstrates how memory forensics, powered by Volatility, can reveal evidence of active malware that may evade traditional disk-based detection. Through a combination of process enumeration, command-line review, and injected code identification using malfind, we isolated suspicious behavior tied to explorer.exe and reader_sl.exe. By extracting those memory segments and hashing the resulting executables, we confirmed their identity as known Cridex samples via VirusTotal.
This highlights the value of hunting in volatile memory and the importance of cross-validating findings through static and behavioral analysis. As threats continue to evolve, so too must our investigative techniques and memory forensics remains one of the most insightful windows into what truly happened on a compromised system.