Splunk Processing Language (SPL) is a powerful query language used to search, analyze, and visualize data in Splunk. It enables those who use it to extract meaningful information from massive datasets in a quick and efficient manner. With SPL, Users can detect threats, monitor system activity, and troubleshoot issues by filtering logs, aggregating data, and creating real-time dashboards. Its flexibility allows users to craft precise searches, automate alerts, and correlate events across multiple data sources under a centralized dashboard. Mastering SPL is essential for anyone leveraging Splunk for Incident Response or Threat Hunting.
Here’s a list I compiled of some of the most useful SPL queries. These aren’t in any particular order, but general queries that you can expand on. I will go into detail and breakdown what these queries do and how they are useful within the Cybersecurity space.
Find the Top 10 Most Active Processes
index=* sourcetype="WinEventLog:Sysmon" EventCode=1
| stats count by Image
| sort - count
| head 10
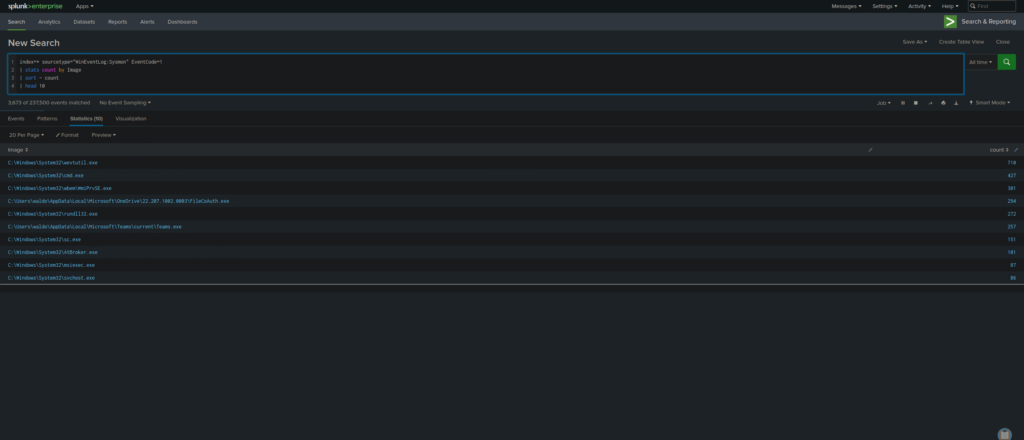
- This query helps identify which processes run most frequently, allowing you to monitor normal vs. abnormal activity.
- It’s useful for detecting malware that repeatedly executes itself, such as persistence mechanisms.
- Helps security teams quickly spot anomalies, like rarely used executables suddenly showing high execution counts.
What It Does:
index=* – Searches all indexes (can be adjusted if needed).
sourcetype=”WinEventLog:Sysmon” – Filters logs to Sysmon data.
EventCode=1 – Only looks at process creation events.
stats count by Image – Counts occurrences of each unique process path.
sort – count – Sorts the results in descending order (most executed processes first).
head 10 – Limits output to only the top 10 processes.
Detect External Network Connection
index=* sourcetype="WinEventLog:Sysmon" EventCode=3
| stats count by DestinationIp DestinationPort ProcessName
| sort - count
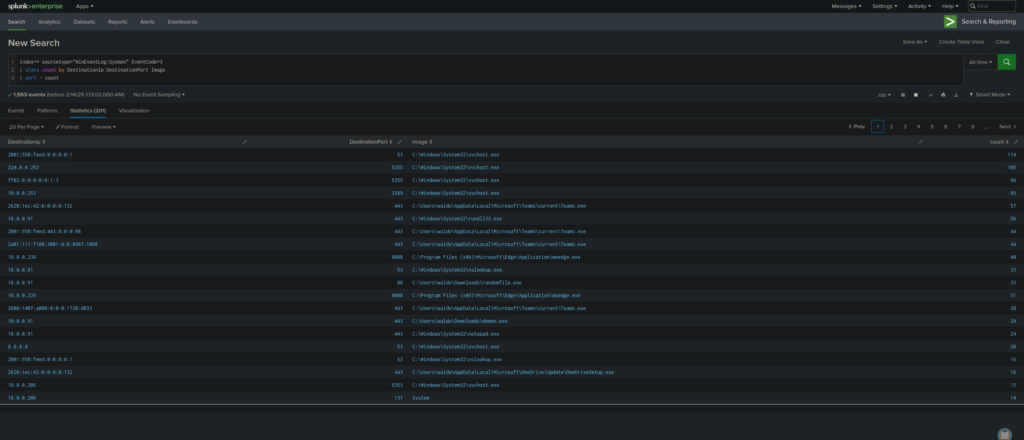
- Identifies outbound network connections made by different processes, helping spot data exfiltration or C2 traffic.
- Useful for detecting unexpected connections, like internal hosts reaching out to external IPs.
- Can help investigate malware activity, such as unusual ports being used by system processes.
What It Does:
index=* – Searches all indexes.
sourcetype=”WinEventLog:Sysmon” – Filters logs to Sysmon data.
EventCode=3 – Only looks at network connection events.
stats count by DestinationIp DestinationPort Image – Groups data by destination IP, port, and the process making the connection.
sort – count – Sorts in descending order (most frequently connected IPs first).
Find Newly Created or Dropped Files
index=* sourcetype="WinEventLog:Sysmon" EventCode=11
| table _time host Image TargetFilename
| sort - _time
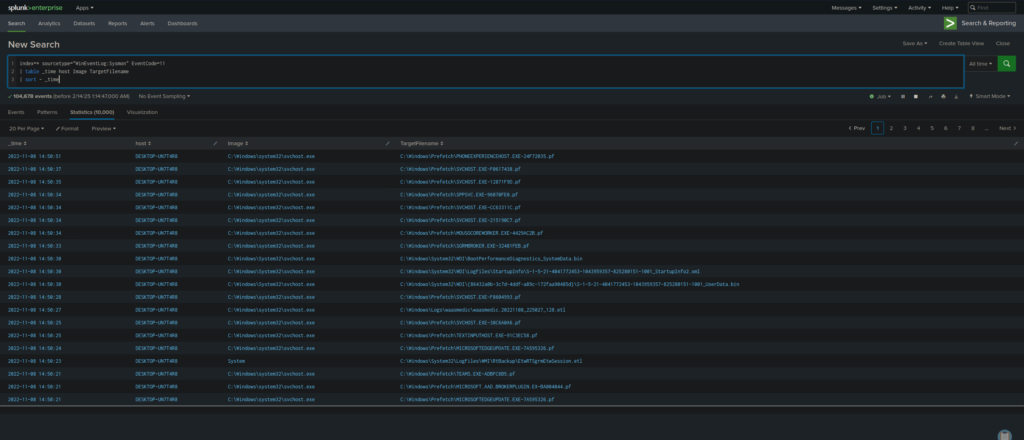
- Helps track malware that drops new files onto a system, such as persistence mechanisms.
- Useful for detecting unauthorized file creation, such as attackers dropping malicious payloads in unusual directories.
- Can also be used for incident response, identifying what files were created before or after an attack.
What It Does:
index=* – Searches all indexes.
sourcetype=”WinEventLog:Sysmon” – Filters logs to Sysmon data.
EventCode=11 – Only looks at file creation events.
table _time host Image TargetFilename – Displays timestamp, host, process path, and the file that was created.
sort – _time – Sorts results by most recent file creations.
Detect Process Execution via Command Line
index=* sourcetype="WinEventLog:Sysmon" EventCode=1
| table _time host ProcessName CommandLine
| sort - _time
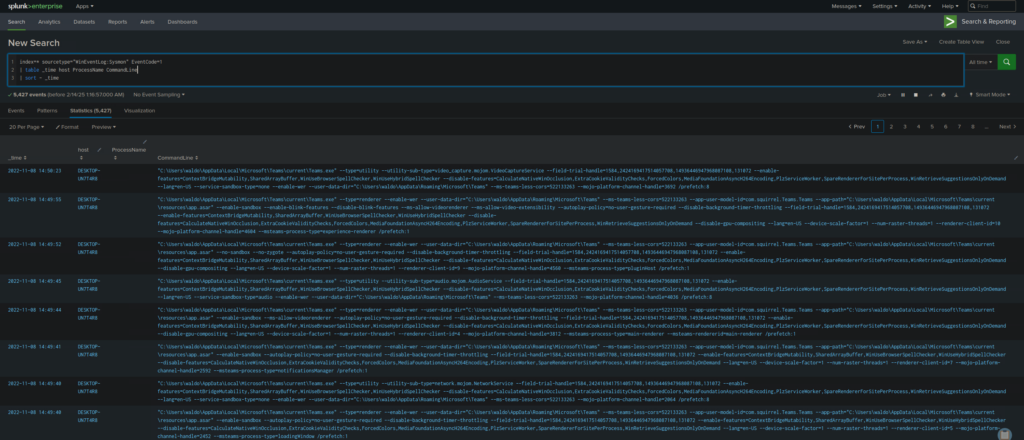
- Provides visibility into exactly how a process was executed, including command-line arguments.
- Helps detect PowerShell-based attacks, encoded commands, and other script execution methods.
- Can reveal suspicious behavior, such as cmd.exe /c powershell -EncodedCommand used by attackers.
What It Does:
index=* – Searches all indexes.
sourcetype=”WinEventLog:Sysmon” – Filters logs to Sysmon data.
EventCode=1 – Only looks at process creation events.
table _time host Image CommandLine – Displays timestamp, host, process path, and command-line arguments.
sort – _time – Sorts results to show the most recent executions first.
Find Event Logs That Were Cleared
index=* sourcetype="WinEventLog:Security" EventCode=1102
| table _time host user
| sort - _time
- Attackers often clear security logs to cover their tracks after a compromise.
- Helps detect insider threats or unauthorized log deletion.
- Useful for investigating privilege misuse, since only admins should be clearing logs.
What It Does:
index=* – Searches all indexes.
sourcetype=”WinEventLog:Security” – Filters logs to Windows Security events.
EventCode=1102 – Identifies when logs were cleared.
table _time host user – Displays timestamp, host, and user who performed the action.
sort – _time – Sorts results to show the most recent log-clearing events first.
Find Parent-Child Process Relationships
index=* sourcetype="WinEventLog:Sysmon" EventCode=1
| table _time host ProcessName ParentProcessId ProcessId CommandLine
| sort - _time
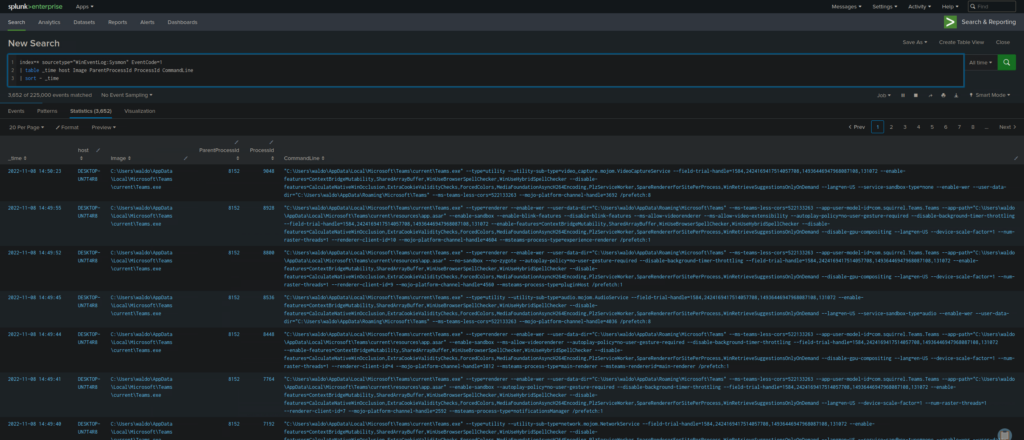
- Helps track which processes spawned other processes, useful for detecting malware execution chains.
- Can reveal suspicious parent-child relationships, such as cmd.exe launching powershell.exe.
- Useful for forensic investigations to see how a specific attack unfolded.
What It Does:
index=* – Searches all indexes.
sourcetype=”WinEventLog:Sysmon” – Filters logs to Sysmon data.
EventCode=1 – Only looks at process creation events.
table _time host Image ParentProcessId ProcessId CommandLine – Displays timestamp, hostname, process path, parent process ID, and command-line arguments.
sort – _time – Sorts by most recent process executions.
Detect Suspicious DLL Injections
index=* sourcetype="WinEventLog:Sysmon" EventCode=8
| table _time host SourceImage TargetImage
| sort - _time
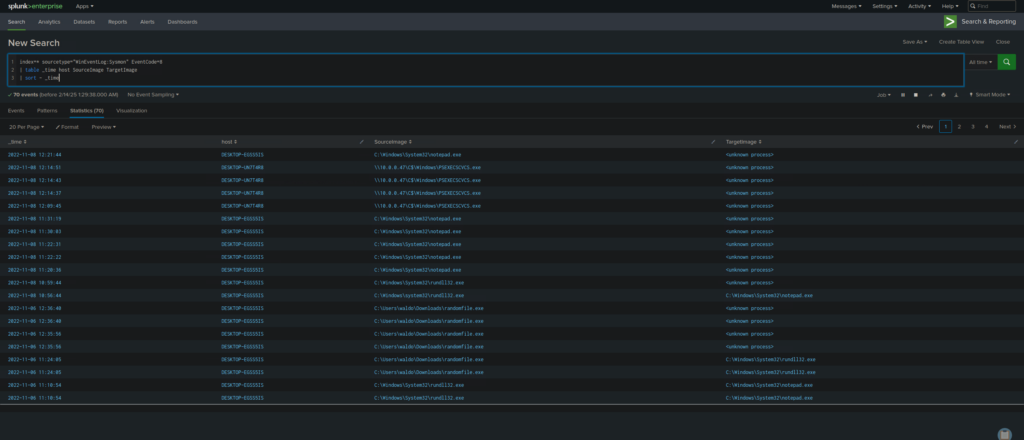
- Detects malware injecting malicious DLLs into legitimate processes (process hollowing).
- Helps identify advanced threats like reflective DLL injection used in fileless malware.
- Useful for finding stealthy backdoors or malware execution techniques that don’t create new processes.
What It Does:
index=* – Searches all indexes.
sourcetype=”WinEventLog:Sysmon” – Filters logs to Sysmon data.
EventCode=8 – Only looks at remote thread creation (DLL injection events).
table _time host SourceImage TargetImage – Displays timestamp, host, source process (injecting process), and target process (where the DLL is injected).
sort – _time – Sorts results by most recent DLL injection attempts.
Find High Volume of Network Connections Per Process
index=* sourcetype="WinEventLog:Sysmon" EventCode=3
| stats count by ProcessName
| sort - count
| head 10
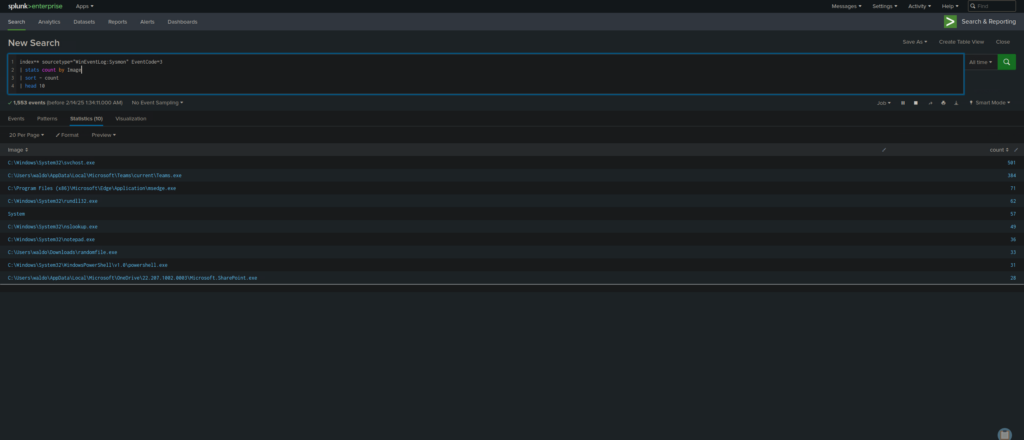
- Identifies which processes are making the most outbound network connections.
- Helps detect malware beaconing, C2 traffic, or data exfiltration attempts.
- Can be used to investigate which applications are communicating excessively over the network.
What It Does:
index=* – Searches all indexes.
sourcetype=”WinEventLog:Sysmon” – Filters logs to Sysmon data.
EventCode=3 – Only looks at network connection events.
stats count by Image – Groups results by process path and counts the number of connections per process.
sort – count – Sorts results to show the most network-active processes first.
head 10 – Limits results to the top 10 processes making network connections.
Detect Use of Dangerous PowerShell Commands
index=* sourcetype="WinEventLog:Microsoft-Windows-PowerShell/Operational"
| search Message="Invoke-Expression" OR Message="IEX" OR Message="DownloadString" OR Message="EncodedCommand"
| table _time host UserID Message
| sort - _time
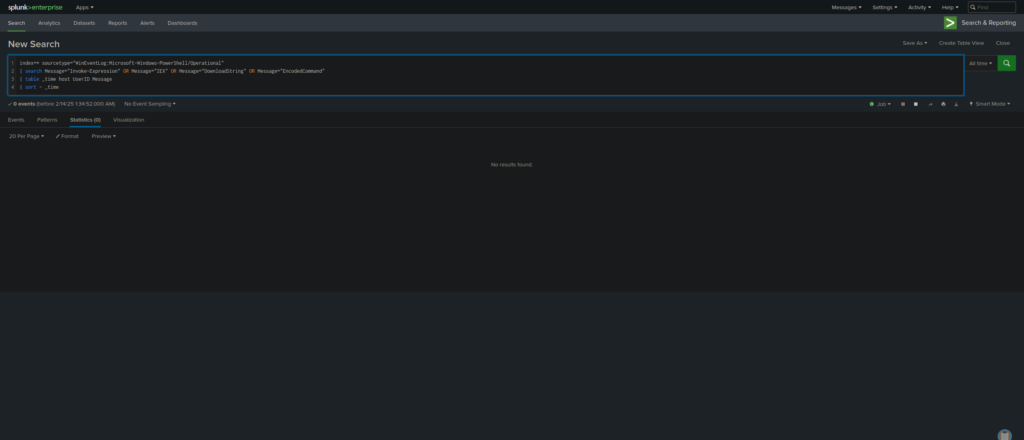
- Detects malicious PowerShell commands often used in attacks (e.g., downloading and executing scripts from the internet).
- Helps security teams monitor for fileless malware execution via PowerShell.
- Can reveal encoded or obfuscated commands commonly used in evasion techniques.
What It Does:
index=* – Searches all indexes.
sourcetype=”WinEventLog:Microsoft-Windows-PowerShell/Operational” – Filters logs to PowerShell execution events.
search Message=”Invoke-Expression” OR Message=”IEX” OR Message=”DownloadString” OR Message=”EncodedCommand” – Filters for common malicious PowerShell commands used in attacks.
table _time host UserID Message – Displays timestamp, host, user ID, and the PowerShell command executed.
sort – _time – Sorts results by the most recent PowerShell executions.
Find Failed Logins (Brute-Force Detection)
index=* sourcetype="WinEventLog:Security" EventCode=4625
| stats count by Account_Name host
| sort - count
| head 10
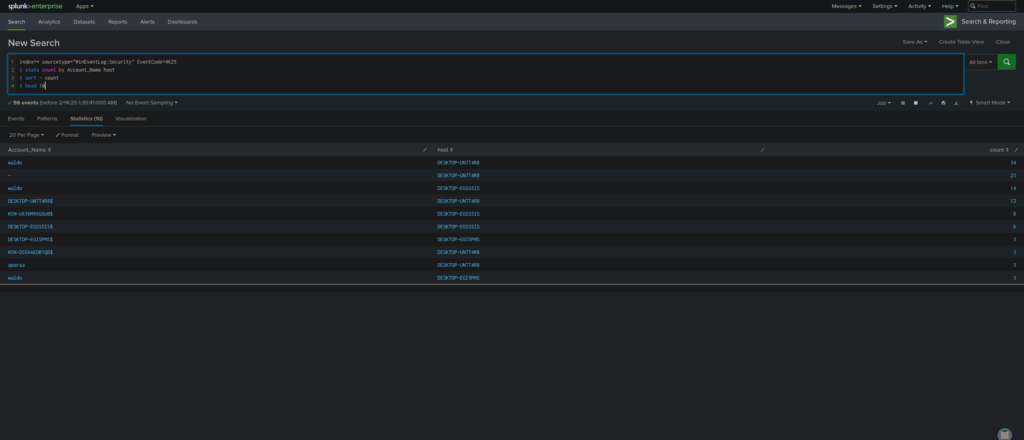
- Detects brute-force attacks by identifying multiple failed login attempts for the same user.
- Helps track compromised accounts or credential stuffing attacks.
- Useful for monitoring insider threats and tracking login abuse.
What It Does:
index=* – Searches all indexes.
sourcetype=”WinEventLog:Security” – Filters logs to Windows Security logs.
EventCode=4625 – Identifies failed login attempts.
stats count by Account_Name host – Groups results by user account and host to see which accounts are experiencing multiple failed logins.
sort – count – Sorts results to show the most frequent failed logins first.
head 10 – Limits results to the top 10 accounts with the most failed logins.

